
Program Chair Dave Crandall introduced Bruce, who graduated from Williams College with a bachelor’s in chemistry and environment. He has a doctorate in Soil Science, and for 29 years he served as a professor at the University of Maryland. He serves on the Lebanon Conservation Commission and teaches OSHER courses. He enjoys being outside.
Bruce said he would not give us his opinions but would rather present facts about “climate disruption” and the effects on climate disruption from our current practices of agriculture, systems of food provision, and the diet we choose. Bruce may be reached here for further conversation:
Bruce proved to be one of our most articulate and easily understood speakers, his long years of teaching experience standing him in good stead with complicated subject matter. If you’d like a copy of his slides, please ask brucepacht67@gmail.com.
Climate Disruption is HERE!
- Earth’s atmosphere is warming, but not uniformly.
- Changes—colder, wetter, warmer, drier.
- Glaciers are melting and some will cause sea level rise.
- The ocean “conveyor belt” that carries warm water to high latitudes from the equator is slowing.
- Methane CH4 (natural gas) is much more destructive than CO2, carbon dioxide
Meat vs. Plants – How do all these things stack up?
- Humans have been agricultural animals for the last 10,000 years.
- Most of what we grow is beans, grains, and nuts. We mostly eat grass seeds such as corn and wheat; also, we eat animals that eat these seeds. We also eat vegetables and dairy products.
These are the six animals we typically eat: goat, pig, sheep, cow, horse, deer.
- All but the pig and horse are “ruminants” with cleft hooves and a “rumen”—a four-chamber “fermenting digestion ecosystem” far different from our stomachs and intestines.
- Ruminants can survive on grass and forage (cellulose) from relatively infertile soil. Humans cannot digest cellulose (fiber).
- Ruminants are not well-adapted to eat grain such as corn—grass is more healthy for them.
- Unfortunately, cows’ belches include carbon dioxide and methane made by microorganisms that live in the rumen, making these animals significant greenhouse gas emitters.
Per capita emitters of caron dioxide (CO2)—
- Most human-caused comes from heating, electricity, and transportation.
Per capita emitters of methane (CH4), a much more powerful pollutant than CO2.
- #1 Agriculture.
- #2 Fugitive emissions from natural gas in the earth that escapes, such as that which had been trapped in increasingly melting Arctic ice and permafrost. Also fracking and other sources.
- #3 Waste in landfills and food.
Up to HALF of all global emissions of methane comes from our food system.
There actually isn’t much methane in our atmosphere now compared to when the earth was first forming. When earth was forming, there was a lot of methane, and it was super-hot.
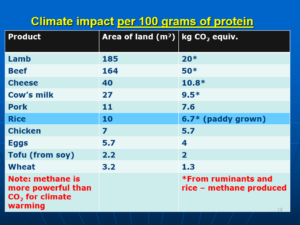
Everything we eat has an impact, but some things are more impactful than others.
Here is the climate impact per 100 grams of protein derived from the following sources:
- *Lamb = 20 kilograms (kg) CO2 equivalent and 185 square meters (SM) of land.
- *Beef = 164 SM and 50 kg and 164 SM.
- *Cheese = 60 SM and 10.8 kg and 60 SM.
- Pork = 7.6/11.
- Rice = 6.7/10.
- Chicken = 5.7/7.
- Eggs = 4/5/7.
- Soy = 2/2.2.
- Wheat = 1.3/3.2.
* = ruminants.
Rice had major and early effects on climate:
- Humans probably started cultivating rice about 8,000 years ago in Asian countries.
- Deforestation for rice planting caused CO2 releases to increase.
- 5,000 years ago, flooded rice (paddy) production caused CH4 releases to increase. Warm, wet soil that’s full of organic stuff produces methane (“swamp gas”). If there’s no oxygen in the soil (“anaerobic”), there will be methane. The microbes that make methane don’t live on oxygen.
- Transplantation of rice seedlings in a flooded paddy is labor-intensive; water must be managed to alternate flooding and dry periods. The land, therefore, must be flat which meant that in mountainous regions, the land has terraced.
- About one-third of the world’s population eats rice daily, some three times a day.
Energy efficiency and food waste:
- In terms of 1,000s of BTUs (“British Thermal Unit” is the amount of heat required to raise 1 pound of water 1 degree, about 0.25 kcal).
- Grains and vegetables require the lowest energy levels to produce with about 32% wasted.
- Meat, poultry, fish, and eggs require 2-4 times as much energy to produce and generate 16-32% waste.
In our modern society, most of this waste is created pre-consumer; in most other countries, waste is post-consumer.
Fish waste is also a source of methane.
- Fish and seafood production is measured in the sum of seafood from wild catch and fish farming (aquaculture, in metric tons (t).
- Top four population countries: India, China, USA, Indonesia
- Biggest seafood and fish consumption is China, India, and Indonesia— containing 38% of the world’s population. They are also countries that eat a lot of rice.
- Biologically sustainable fish species have declined from 90% to 65% of the fish we eat; overexploited stocks are up from 10% to 35%, though many fish stocks in Africa Asia and South American have not been fully assessed.
Where does seafood come from especially in high-consuming countries from 1960-2020+?
- Aquaculture soared from almost nothing to 120 million tons/year.
- “Capture fisheries” (hook and net in open waters) from 40 to 100 million tons.
- This marks a huge change in where we are getting the fish we eat. There are environmental impacts from both capture and aquaculture.
Five Suggested Integrated solutions:
- Stop expanding agriculture’s footprint—reduce deforestation.
- Close yield gaps: raise actual yields to match what is possible.
- Use resources more efficiently: energy, water, fertilizers, land.
- Create personal and regional responses.
- Shift human diets away from meat; make different choices and reduce quantities.
Recent Comments